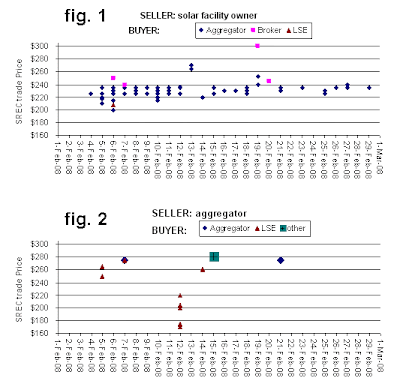
Shown below are the SREC trades and prices for Feb 2008. These are broken up into two figures by seller, either solar facility owner (fig. 1), or aggregator (fig 2). For either seller, the data is separated by buyer: aggregator, broker, LSE - load serving entity, or other. While it's not apparent from the graphs, any one data point may reflect the sale of just 1 or maybe many SRECs on that day and price. You'll have to look at the spreadsheet to answer that for now. Note also the price for 38 separate trades from solar facility owners, in fig 1, to broker buyers were not reported, hence not graphed.
(click image to enlarge)
Friday, March 28, 2008
Feb 2008 SREC trades and prices
Posted by
jm
at
5:55 PM
1 comments
![]()
![]()
solar project updates
The list of completed solar projects in NJ was recently updated for installations finished in Jan-Feb of 2008; these will be added/graphed here by Apr 1. But the spreadsheet is online now here (Excel 1 MB)
Posted by
jm
at
12:16 PM
1 comments
![]()
![]()
Subscribe to:
Posts (Atom)

